Monitoring Training with TensorBoard
TensorBoard is a powerful tool that allows you to visualize and monitor the training process of your voice models. By keeping an eye on the graphs in TensorBoard, you can get a better understanding of how your model is learning and identify potential issues like overtraining.
How to Use TensorBoard
Section titled “How to Use TensorBoard”- Launch TensorBoard: Run the
run-tensorboard.batfile in your Applio directory, or open a terminal and run the commandtensorboard --logdir=logs. - Open in Browser: Open your web browser and navigate to
http://localhost:6006(or the address shown in your terminal). - Navigate to Scalars: In the TensorBoard interface, click on the Scalars tab.
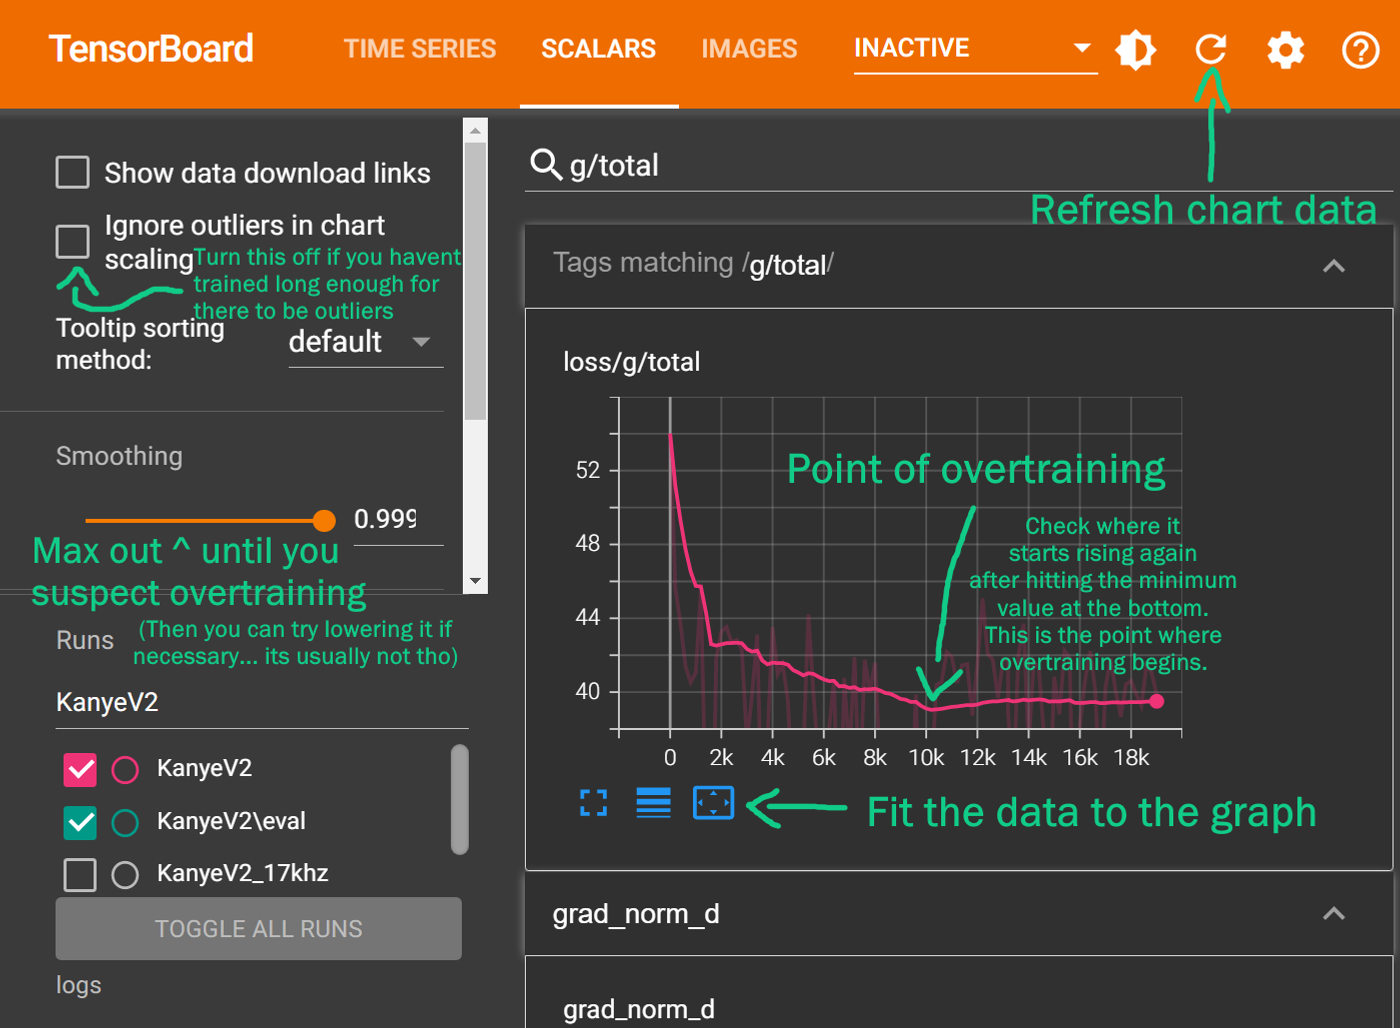
- Find the “g/total” Graph: This graph shows the total loss for the generator, which is the most important metric for tracking the overall progress of your training.
Preventing Overtraining with TensorBoard
Section titled “Preventing Overtraining with TensorBoard”Overtraining happens when a model learns the training data too well, including its noise and imperfections. An overtrained model will perform poorly on new data, so it’s important to stop training at the right time.
The “lowest point” on the g/total graph is a good indicator of when to stop training. This is the point where the loss value is at its lowest before it starts to rise or plateau.
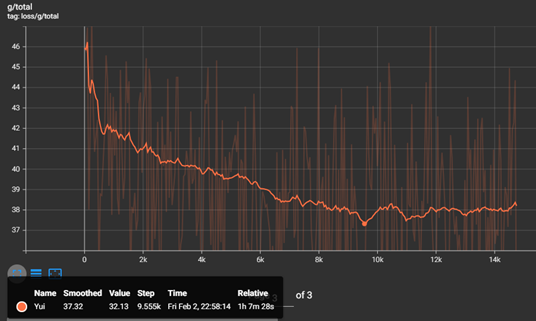
To find the best version of your model, look for the lowest point on the g/total graph and note the corresponding step number. You can then find the saved model file (.pth) with the closest step number in your logs folder.
Advanced Monitoring
Section titled “Advanced Monitoring”For more advanced users, you can also monitor these graphs:
loss/g/mel: The mel spectrogram loss. This should generally decrease throughout training. If it starts to rise, it could be a sign of overtraining.loss/g/kl: The KL divergence loss. This should also decrease over time.loss/d/total: The total discriminator loss. This will likely go up at the beginning of training and then start to decrease.
A healthy training process will show a general downward trend in all these loss values over time. By keeping an eye on these graphs, you can gain a deeper understanding of your model’s training process and make more informed decisions.