Audio Analyzer
The Audio Analyzer is a powerful tool that provides detailed information about your audio files, including sample rate, frequency distribution, and more. This information is crucial for training high-quality voice models.
Why is the Sample Rate Important?
Section titled “Why is the Sample Rate Important?”Applio’s pre-trained models are available in three sample rates: 32k, 40k, and 48k (corresponding to 32,000 Hz, 40,000 Hz, and 48,000 Hz). For the best training results, the sample rate of your dataset should match the sample rate of the pre-trained model you are using.
While you can check the sample rate in audio editors like Audacity, the Audio Analyzer provides a more detailed analysis of your audio’s frequency content.
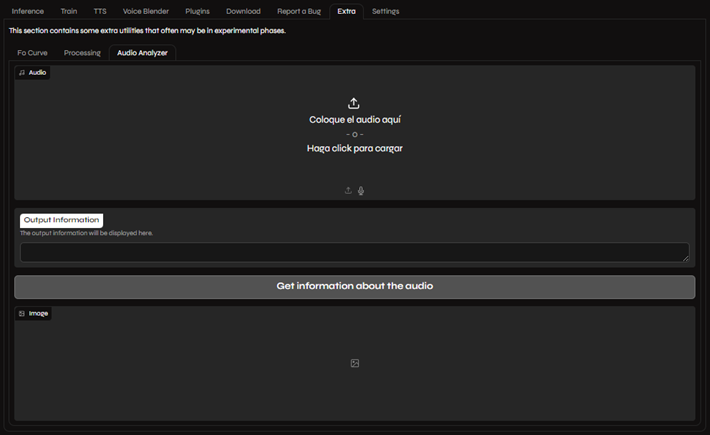
How to Use the Audio Analyzer
Section titled “How to Use the Audio Analyzer”- Navigate to the Extras tab in Applio.
- Upload your audio file using the Upload Audio box.
- Click the Get Information About Audio button.
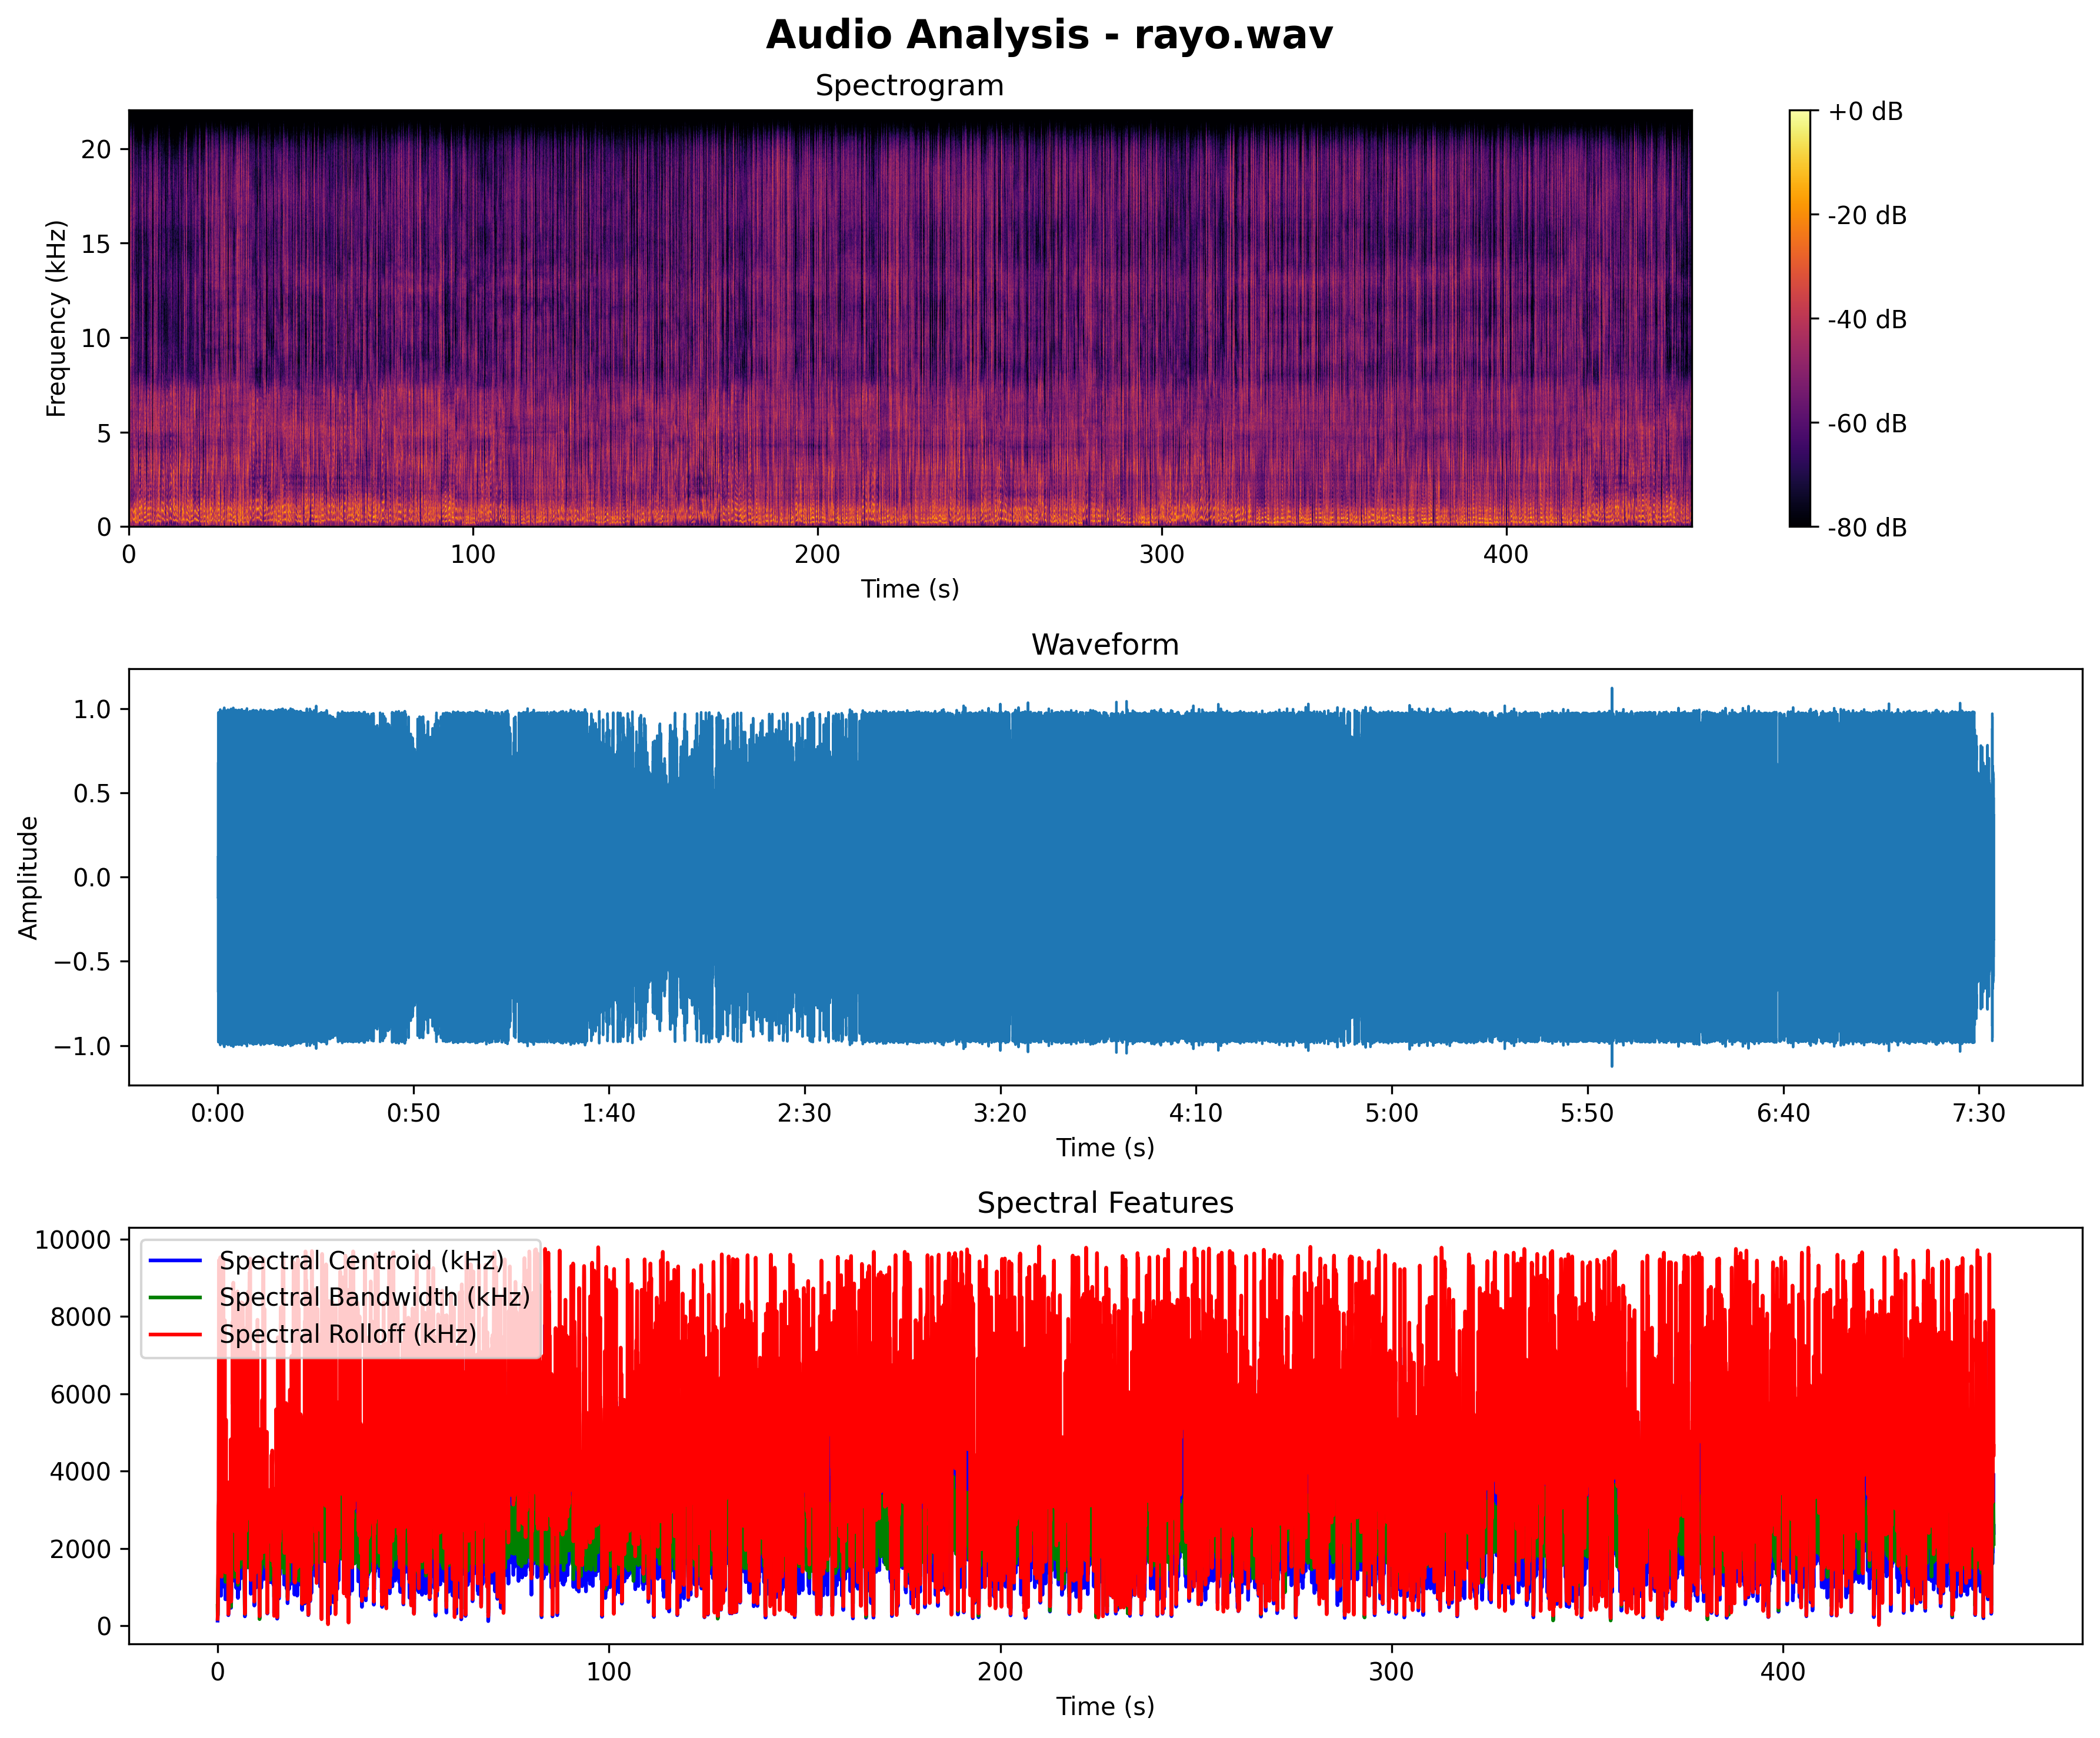
Once the analysis is complete, you will see a detailed breakdown of your audio file, including a spectrogram and several spectral feature graphs.
Understanding the Graphs
Section titled “Understanding the Graphs”The graphs provided by the Audio Analyzer can help you identify issues with your audio and fine-tune your training settings for optimal results.
Spectrogram
Section titled “Spectrogram”The spectrogram is a visual representation of the frequencies in your audio over time. It can help you identify unwanted noise, such as background hiss or electrical hum, which you can then remove using an audio editor.
Spectral Features
Section titled “Spectral Features”The spectral feature graphs provide a more detailed look at the frequency content of your audio.
- Spectral Centroid: This graph represents the “center of mass” of the spectrum. A higher spectral centroid indicates that the audio has more high-frequency content, while a lower spectral centroid indicates more low-frequency content. This can help you understand the overall brightness or darkness of the audio.
- Spectral Bandwidth: This graph shows the range of frequencies in the audio. A wider bandwidth indicates a more complex sound with a wider range of frequencies, while a narrower bandwidth indicates a simpler sound.
- Spectral Rolloff: This graph shows the frequency below which a certain percentage of the total spectral energy lies. It’s another way to measure the “skewness” of the spectral distribution and can be useful for distinguishing between different types of sounds.
By understanding these graphs, you can make more informed decisions about your audio processing and training settings, leading to better voice models.